
Overview
July data came to show an increase in the grain exports, and a continuous decrease in the oil ones.
Brazil exported about 31,600 metric tons of peanuts, and 6,500 metric tons of oil during the month.
Peanuts
Total
Peanuts export in 2023 x 2022
| Months | 2023 - (Tons) | 2022 - (Tons) | Var (%) |
| Jan | 20.702 | 24.698 | -16,18% |
| Feb | 15.756 | 21.798 | -27,72% |
| March | 18.472 | 17.132 | 7,82% |
| April | 22.425 | 14.161 | 58,36% |
| May | 27.193 | 20.885 | 30,20% |
| June | 25.542 | 31.055 | -17,75% |
| July | 31.630 | 23.327 | 35,59% |
| Total | 161.720 | 153.056 | 5,66% |
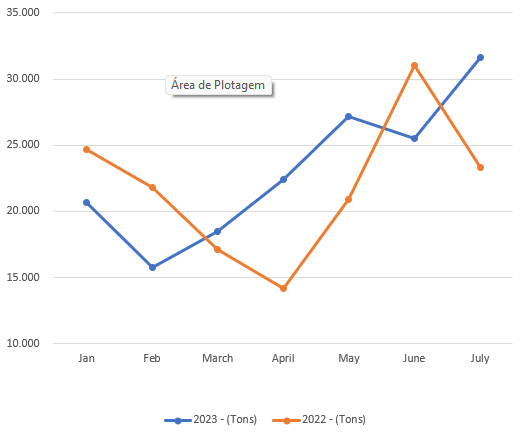
Whereas in the previous year, the 7th month showed a big decrease, this year an increase is clearly seen, this brings the calendar of year 2023 to a total of about 162 thousand tons exported, a slight 5,6% increase, compared to the 156 thousand tons of 2022.
Destination
The main destinations are still the same, Russia, Algeria, and the EU, all of which, showed increased volume in their imports compared to June:
| Months | Russia | Algeria | EU27 | Brazilian Total Export |
|---|---|---|---|---|
| Jan | 8.754 | 1.077 | 4.758 | 20.702 |
| Feb | 4.594 | 5.065 | 2.118 | 15.756 |
| March | 3.473 | 6.000 | 2.385 | 18.472 |
| April | 3.300 | 8.215 | 2.686 | 22.425 |
| May | 4.781 | 9.123 | 4.549 | 27.193 |
| June | 7.965 | 5.973 | 3.320 | 25.542 |
| July | 8.865 | 8.077 | 7.777 | 31.630 |
| Total | 41.731 | 43.530 | 27.594 | 161.720 |
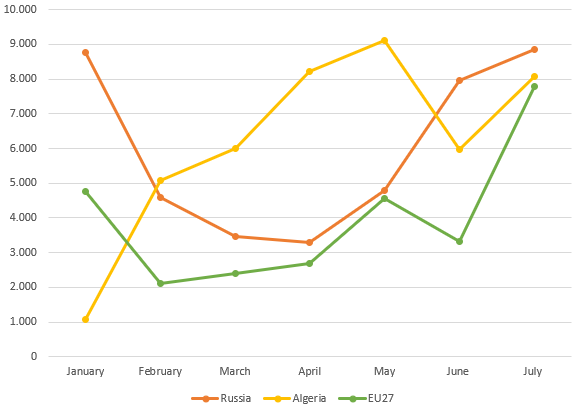
The increase in Russian imports seems to be due to the demand coming back after a period of overstock, and the freights to St. Petersburg showing a decrease, which allows importers to increase their volume arriving directly to the Russian port, not having to bring the goods from Tallin or Riga.
It’s hard to understand the Algerian movements, one could hear of overstock there about two months ago, now we see another month of good volumes.
EU increase is likely due to contracts being fulfilled. The exporters don’t seem to be offering at this moment. It’s also important to remember that Letonia and Estonia are among the 27, which means some of those peanuts are likely going to Russia.
An important point for the Brazilian exporters focused on EU is that there is no RASFFs registered for Brazilian peanuts since January.
Peanut oil
Peanut Oil export in 2023 x 2022
| Months | 2023 - (Tons) | 2022 - (Tons) | Var (%) |
|---|---|---|---|
| Jan | 7.298 | 5.301 | 37,68% |
| Feb | 4.092 | 5.852 | -30,08% |
| March | 7.439 | 7.359 | 1,08% |
| April | 12.746 | 13.023 | -2,12% |
| May | 9.706 | 12.045 | -19,42% |
| June | 8.807 | 11.836 | -25,59% |
| July | 6.543 | 13.446 | -51,34% |
| Total | 56.631 | 68.861 | -17,76% |
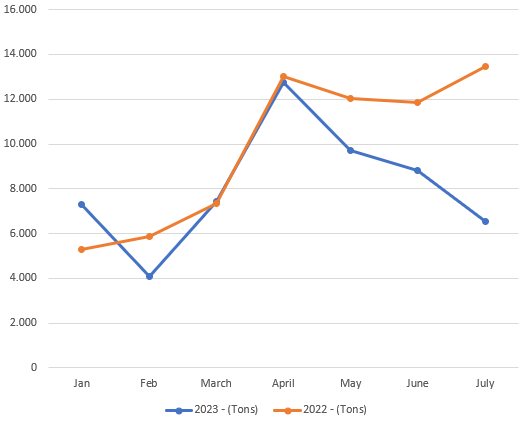
It’s interesting to see the lines and remember that during this time in the previous year, the peanut oil exports were impressive, and did not show signs of decreasing, Brazil ended up exporting a total of 136 thousand tons in 2022.
Peanut crushing factories were built, exporters of grain showed to be worried and the oil crushers could pay more for the farmer stocks… then China’s demand decreased, due to several topics.
We are starting to see the results of the decreased demand more clearly now, in the export numbers.
Destinations
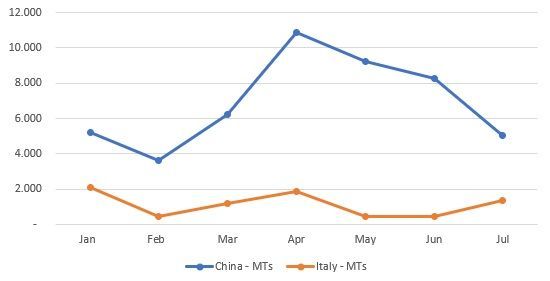
The main destination is China, by far, followed by Italy. With much lower volumes follow USA, The Netherlands and Japan.
Exported volumes to main destinations so far
| Months | China – MTs | Italy – MTs |
|---|---|---|
| Jan | 5.203 | 2.094 |
| Feb | 3.649 | 433 |
| March | 6.225 | 1.213 |
| April | 10.890 | 1.855 |
| May | 9.235 | 434 |
| June | 8.250 | 485 |
| July | 5.042 | 1.365 |
| Total | 48.494 | 7.878 |