

Overview
In a very hard scenario for those looking to buy farmer stocks, the peanuts exports keep increasing and the oil exports, decreasing.
Farmers are asking for 115 BRL (23,5 USD) or more, for the 25kg bag in shell. Exporters are reluctant to pay such values, this situation is likely to stay until the end of the seed production period.
Peanuts
Total
Peanuts export in 2023 x 2022
| Month | 2023 - (Tons) | 2022 - (Tons) | Var (%) |
|---|---|---|---|
| Jan | 20.702 | 24.698 | -16,18% |
| Feb | 15.756 | 21.798 | -27,72% |
| March | 18.472 | 17.132 | 7,82% |
| April | 22.425 | 14.161 | 58,36% |
| May | 27.193 | 20.885 | 30,20% |
| June | 25.542 | 31.055 | -17,75% |
| July | 31.630 | 23.327 | 35,59% |
| August | 34.730 | 24.030 | 44,53% |
| Total | 196.450 | 177.086 | 10,93% |
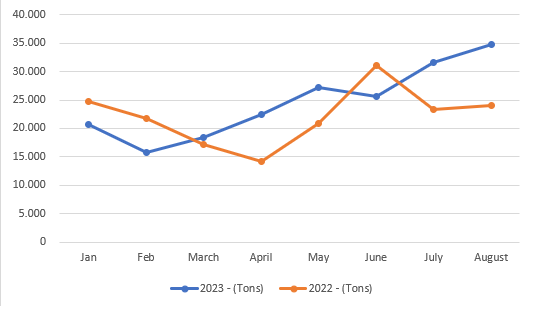
Peanut exports during August were of 34,730 metric tons, an increase of 10% compared to July, bringing 2023 calendar year to 196.450 metric tons, 11% above the same period of 2022.
Destination
| Months | Russia | Algeria | EU27 | Total Export |
|---|---|---|---|---|
| January | 8.754 | 1.077 | 4.758 | 20.702 |
| February | 4.594 | 5.065 | 2.118 | 15.756 |
| March | 3.473 | 6.000 | 2.385 | 18.472 |
| April | 3.300 | 8.215 | 2.686 | 22.425 |
| May | 4.781 | 9.123 | 4.549 | 27.193 |
| June | 7.965 | 5.973 | 3.320 | 25.542 |
| July | 8.865 | 8.077 | 7.777 | 31.630 |
| August | 11.630 | 8.132 | 5.761 | 34.730 |
| Total | 53.361 | 51.662 | 33.355 | 196.450 |
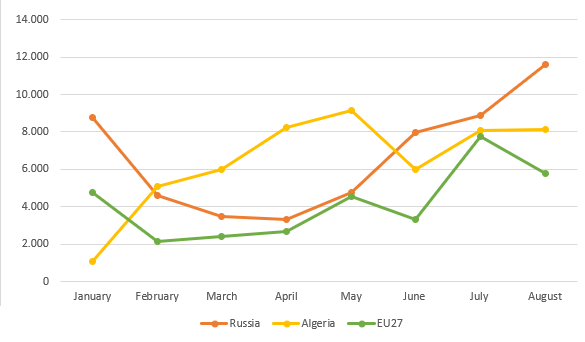
The destinations volumes go in three different directions, as the export to Russia grows, Algeria maintains and EU decreases.
Russia shows the biggest difference compared to July, with a 32% increase, resulting in a total of 53 thousand metric tons. Resulting in 27% of the Brazilian total export, going directly to Russian ports.
Algeria by itself represents 26% of the Brazilian total export, with 51 thousand metric tons imported.
The EU has around 17%, with 33 thousand metric tons. The Netherlands being the biggest importer with 15.5 thousand. Followed by Poland (6,4 thousand) and Spain (5,6 thousand).
Peanut Oil
Peanut Oil export in 2023 x 2022
| Month | 2023 - (Tons) | 2022 - (Tons) | Var (%) |
|---|---|---|---|
| Jan | 7.298 | 5.301 | 37,68% |
| Feb | 4.092 | 5.852 | -30,08% |
| March | 7.439 | 7.359 | 1,08% |
| April | 12.746 | 13.023 | -2,12% |
| May | 9.706 | 12.045 | -19,42% |
| June | 8.807 | 11.836 | -25,59% |
| July | 6.543 | 13.446 | -51,34% |
| August | 5.456 | 13.364 | -59,17% |
| Total | 62.087 | 82.225 | -24,49% |
The oil exports are still decreasing, with the Chinese demand still low. August showed 5,456 tons exported, 60% decrease compared to the same month last year. And a 25% decrease compared to the January – August period of 2022.
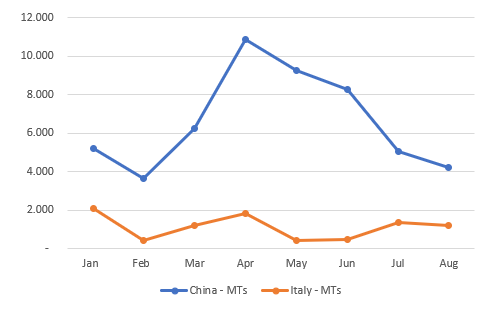
Destinations
Exported volumes to main destinations so far.
| Month | China – MTs | Italy - MTs |
|---|---|---|
| Jan | 5.203 | 2.094 |
| Feb | 3.649 | 433 |
| Mar | 6.225 | 1.213 |
| Apr | 10.890 | 1.855 |
| May | 9.235 | 434 |
| Jun | 8.250 | 485 |
| Jul | 5.042 | 1.365 |
| Aug | 4.230 | 1.224 |
| Total | 52.724 | 9.102 |
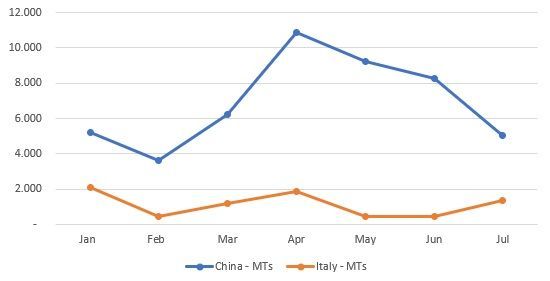
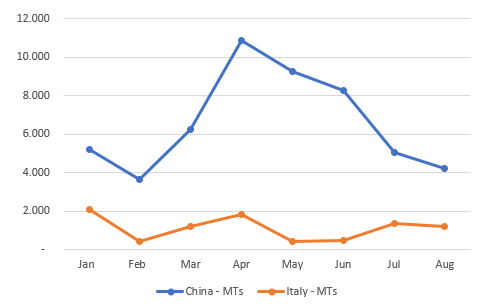
The volumes per destination are getting closer as the exports to China continuously decrease, while the exports to Italy seem to remain constant.
I hope this can help in you in anyway.
Feel free to contact me for any questions.